Here are three metrics that can help you find out.
As you consider improvements to your website, it pays to know what's working – and Google Analytics holds the keys. If don't have much experience with Analytics, it's easy to get lost in a maze of data, but it's not as scary as you think.
Let's run down some basic metrics that will tell you how well your site is working.
Landing page bounce rates
Bounce rate is the rate of people on your site who see one page and leave. The problem is that too many people look at this statistic in isolation. Your site's overall bounce rate can be misleading if you have a lot of visitors landing on individual pages and exiting.
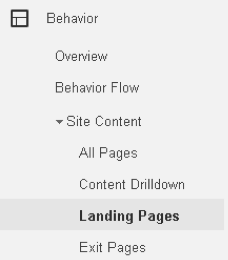
For example, if you have a page with very specific instructions to perform a certain task, it's likely that many people will land on it from a search engine and leave immediately upon reading the instructions. On the other hand, if your home page (or any page built to drive users deeper into the site) has a high bounce rate and users aren't progressing to your product or service pages then you may have some real problems. Find this report at Behavior > Site Content > Landing Pages.
Device performance
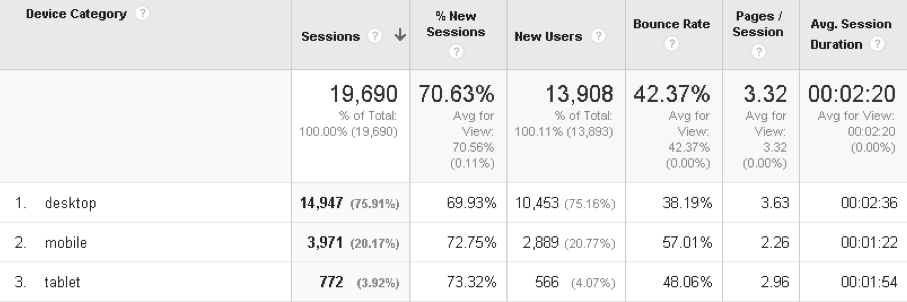
A surprisingly large number of website owners don't pay enough attention to what their sites render on different devices. Fortunately, Google Analytics will tell you how users interact on different devices if you use the report Audience > Mobile > Overview.
If there are major disparities from one device to the next (particularly when sales data is available), it's probable that your site isn't designed to perform on that particular device and should be corrected.
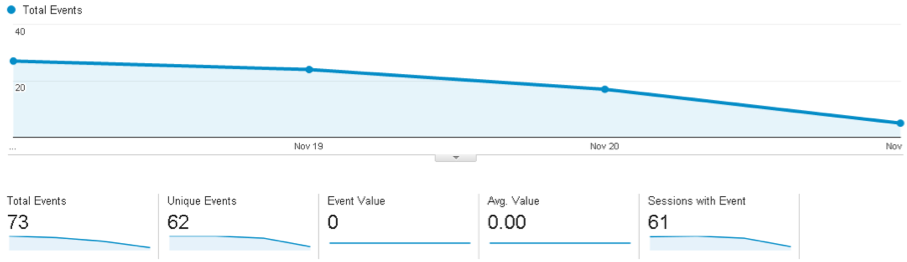
Goals & Events
Nothing says success like knowing how many of your visitors are performing desired actions. Tell Google Analytics your goals and set the events you want to track. That's a separate tutorial in itself, but once set up, you can view the events under Behavior > Events and Conversions > Goals.